pip3 install matplotlib
pip3 list
Package         Version
--------------- --------
matplotlib      3.1.1

pip3 show matplotlib
Name: matplotlib
Version: 3.1.1
Summary: Python plotting package
Home-page: https://matplotlib.org
Author: John D. Hunter, Michael Droettboom
Author-email: matplotlib-users@python.org
License: PSF
Location: /Library/Frameworks/Python.framework/Versions/3.7/lib/python3.7/site-packages
Requires: cycler, pyparsing, numpy, python-dateutil, kiwisolver
Required-by:
When the above
pip3 install
couldn’t find the file
ft2build.h,
I said the following and tried again.
brew install freetype
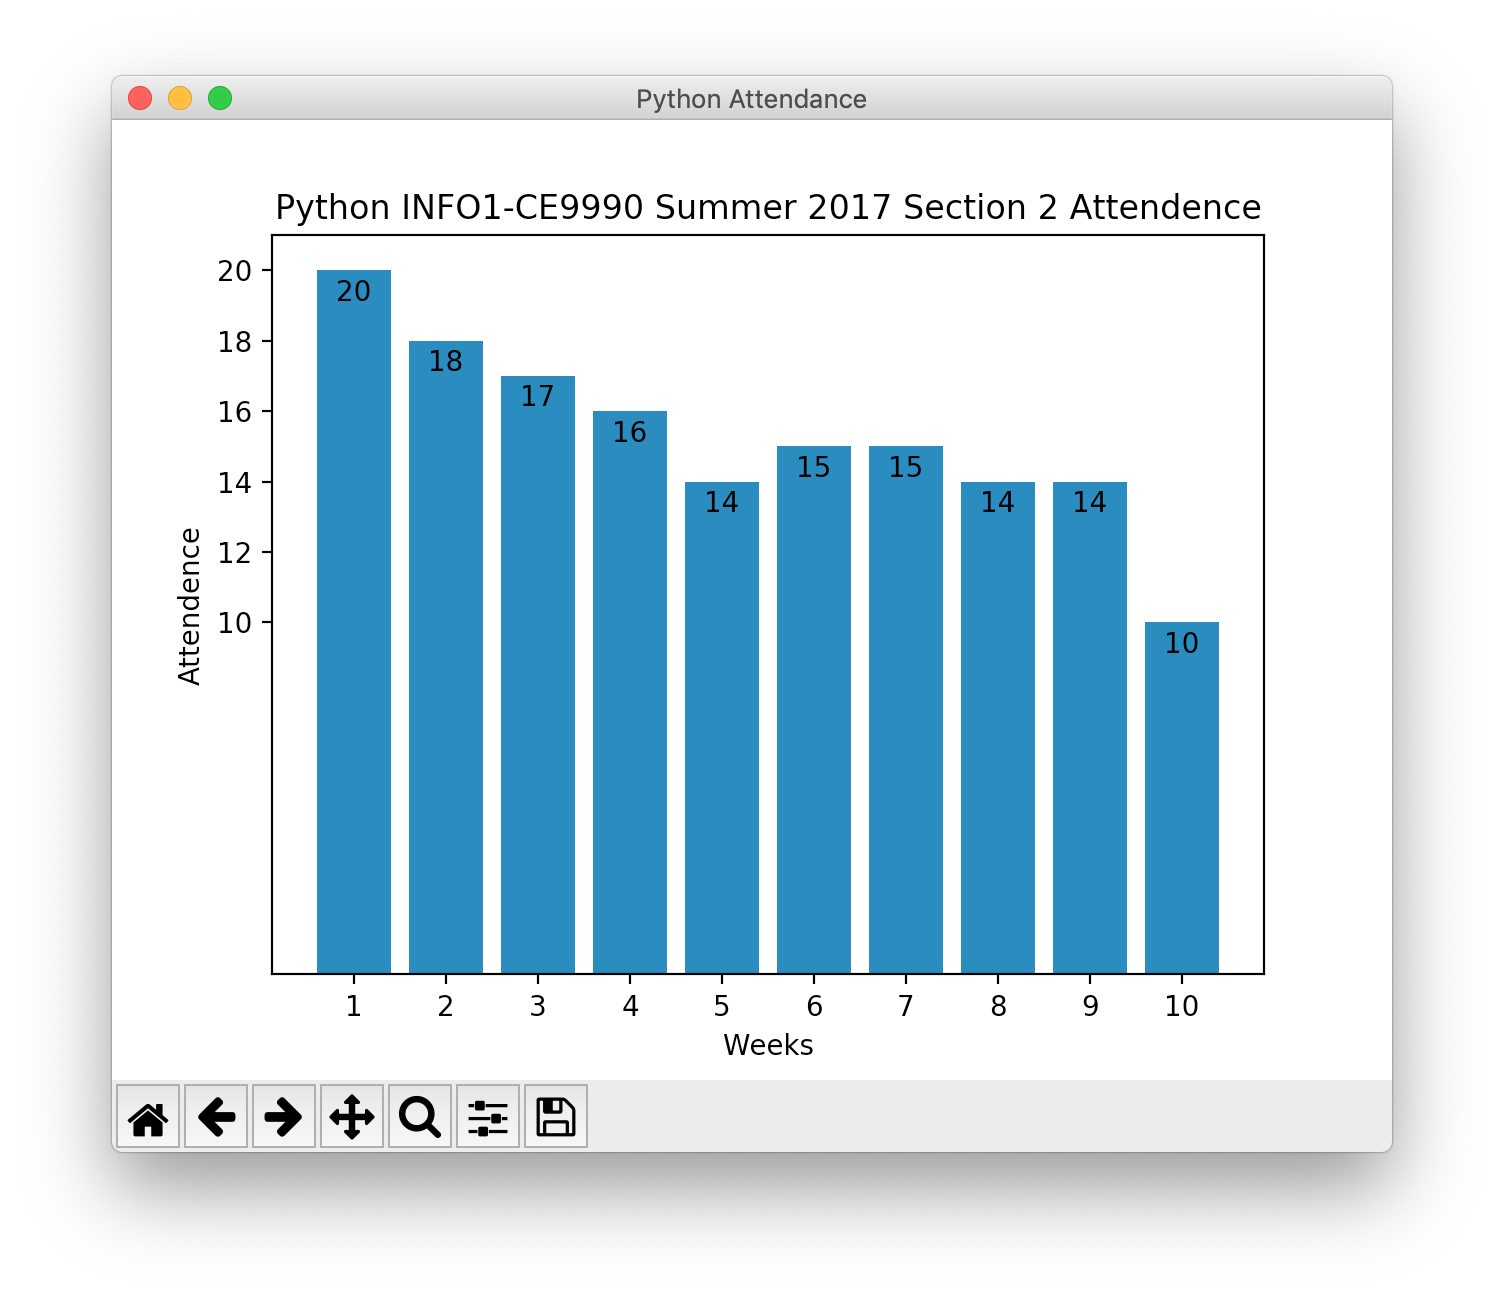
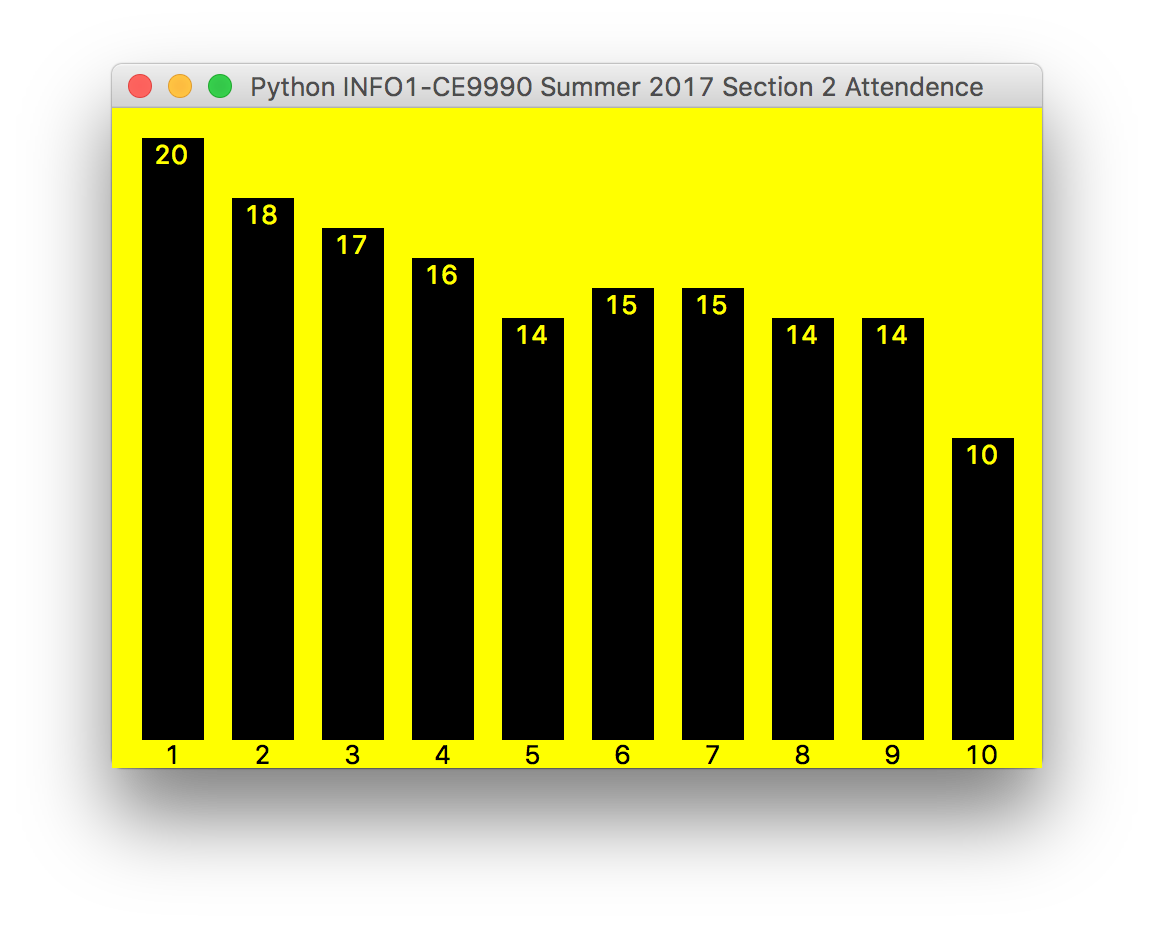
"""
attendance.py

Draw a bar chart of the weekly attendence.
"""

import matplotlib.pyplot

attendance = [
    20, #week  1: June 15, 2017
    18, #week  2: June 22
    17, #week  3: June 29
    16, #week  4: July 6
    14, #week  5: July 13
    15, #week  6: July 20
    15, #week  7: July 27
    14, #week  8: August 3
    14, #week  9: August 10
    10  #week 10: August 17
]

n = len(attendance)

figure, axes = matplotlib.pyplot.subplots()
figure.canvas.set_window_title("Python Attendance")

matplotlib.pyplot.title("Python INFO1-CE9990 Summer 2017 Section 2 Attendence")
matplotlib.pyplot.xlabel("Weeks")
matplotlib.pyplot.ylabel("Attendence")

matplotlib.pyplot.xticks(range(n), range(1, n + 1))
matplotlib.pyplot.yticks(range(10, 21, 2))

bars = matplotlib.pyplot.bar(range(n), attendance, align = "center")

#Print number in top of each bar.
for bar in bars:
    height = bar.get_height()
    axes.annotate(
        height,        #converted into the string to be printed
        xy = (bar.get_x() + bar.get_width() / 2, height),
        xytext = (0, -3),
        textcoords = "offset points", #units in which xytext is given
        ha = "center", #horizontal alignment
        va = "top"     #vertical alignment
    )

matplotlib.pyplot.show()