To see the contents of a
CGRect
named
b,
we could paste the following statement into our app.
	NSLog(@"b == (%g, %g), %g × %g)",
		b.origin.x,
		b.origin.y,
		b.size.width,
		b.size.height
	);
A debugger gives us an easier way to see, and even to change, the value of a variable.
Open the
HelloAppDelegate.m
file of the
Hello, World!
project in Xcode.
To the left of the file are two margins,
a wide one on the left and a narrow, somewhat darker one on the right.
Click in the wide one,
to the left of the line that says
application:didFinishLaunchingWithOptions:.
You should see a blue (or blue outlined)
pentagon like a horizontally stretched home plate.
You have just set a breakpoint at the start of the
application:didFinishLaunchingWithOptions:
method.
To delete the breakpoint,
control-click on it and select
Delete Breakpoint.
Put the breakpoint back in.
Press the Run button.
When you stop at the breakpoint,
the Xcode Console will say
(lldb)
or
(gdb).
The green arrow (a very truncated home plate)
points to the next line or statement to be executed.
It should be pointing to the
application:didFinishLaunchingWithOptions:
line.
This line has not yet been executed.
Let’s walk five statements forward through the program.
To the upper left of the Console,
there is an icon showing an arrow arcing clockwise over a black rectangle.
This is the “Step over” button.
Press this button five times.
You have just executed the statements that assign values to
screen,
applicartionFrame,
bounds,
and
view.
The green arrow should now be pointing to the statement that assigns a value to
sef.window.
To examine the contents of the
CGRect
bounds,
point at the
bounds
in the
CGRect
bounds
statement.
You should get
a red dashed rectangle around the
bounds,
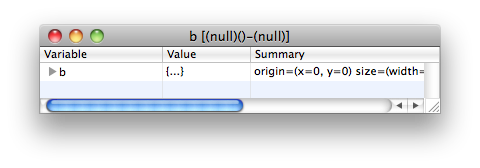
and a long yellow strip saying
▶ CGRect bounds {…} origin=(x=0,y=0) size=(width=320,height=480)
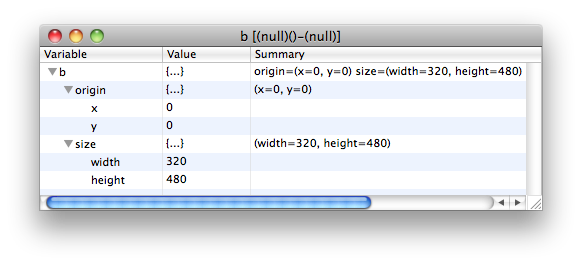
Point at the equilateral triangle to make it point down
and travel down the ▶s.
You will see the fields and the fields of the fields,
listed one per line.
Or click on the pair of tiny triangles,
pointing up and down,
and select Open in Window.
Here are the resulting windows
(with the
bounds
changed to
b):
Also examine the variable
view,
which is much more complicated:
bounds
was merely a structure,
while
view
is (a pointer to) an object.
The
view
contains the four instance variables
_tapInfo,
_gestureInfo,
_gestureRecognizers,
and
_viewFlags.
In addition to being a
View,
the
view
is also a
UIView,
UIResponder,
and
NSObject.
Open the Xcode Console window:
View → Debug Area → Activate Console
The prompt in the window shows the name of the debugger.
It should be
(gdb).
If the prompt is
(lldb),
change it to
(gdb)
as follows.
Product → Edit Scheme…
Select Run on left, Info on upper right.
Debugger: GDB
OK
Then run the project again by pressing the Run button.
The debugger prompt in the Console should now be
(gdb).
view
is a pointer to a
UIView
object.
(gdb) print view
$1 = (View *) 0x6a59840
The
$1 =
(gdb) print $1
Print the
UIView
object itself.
(gdb) print *view
Let’s call the getter method for the
bounds
property of class
UIView.
The name of this method is
bounds.
(gdb) print (CGRect)[view bounds]
$2 = {origin = {x = 0, y = 0}, size = {width = 320, height = 460}}
(gdb) print ((CGRect)[view bounds]).origin
$3 = {x = 0, y = 0}
(gdb) print ((CGRect)[view bounds]).origin.x
$4 = 0
(gdb) po [view backgroundColor]
UIDeviceRGBColorSpace 1 1 0 1
Better yet,
create a gdb macro with one argument.
We will name the macro
rc,
and the argument of the macro is named
$arg0.
The
>
is the continuation prompt that gdb displays.
Do not type the
>.
(gdb) define bo
>print (CGRect)[$arg0 bounds]
>end
(gdb) show user bo
(gdb) show user
(gdb) document bo
>Print the bounds property of the UIView specified as the argument.
>end
(gdb) help bo
Print the bounds property of the UIView specified as the argument.
Execute the macro
and pass one argument (the object
view)
to it.
(gdb) bo view
$5 = {origin = {x = 0, y = 0}, size = {width = 320, height = 460}}
Let’s call the setter method for the
backgroundColor
property of class
UIView.
The name of this method is
void.
Say
call
instead of
print.
(gdb) call (void)[view setBackgroundColor: (UIColor *)[UIColor greenColor]]
Then press the “Continue program execution” button to the left of the “Step over” button. The view in the simulator will be green.